

S Ori

Deep Red image of S Ori from SDSS
Overview
S Ori is a Mira type Long Period Variable (LPV). It has an Oxygen rich spectrum range of M6.5e-M9.5e.
It’s position in the sky is at 05 29 00.90 -04 41 32.8 which makes it viewable from both the northern and southern hemisphere. S Ori is a “winter” star in the northern hemisphere so it’s now in “season.
S Ori pulsates with a period of around 420 days. In the course of a cycle, it changes its brightness by a factor of the order of 500, while its diameter varies by about 20%. The published magnitude range for S Ori is 7.2 to 13.1 in the V band. It’s B-V index is about 1.5 making S Ori a very read star typical of LPVs. Like all Miras all of this can vary a bit from cycle to cycle.
“Astronomers have found the star's diameter to vary between 7.9 milliarcseconds and 9.7 milliarcseconds. At the distance of S Ori, this corresponds to a change of the radius from about 1.9 to 2.3 times the distance between the Earth and the Sun, or between 400 and 500 solar radii!” This means it would larger then the orbit of Mars. S Ori is one of the few Miras stars that have been measured this way.
“S Ori is listed in the Washington Double Star Catalog as a double star with a tenth magnitude companion 47" away. The companion is the G0 star HD 294176.” I have not been able to verify this relationship, in fact I use star HD 294176 (HIP 225669) as my main comparison star for images I take of S Ori at my observatory. This “companion” star has an AUID number of 000-BBJ-405.
Period for S Ori
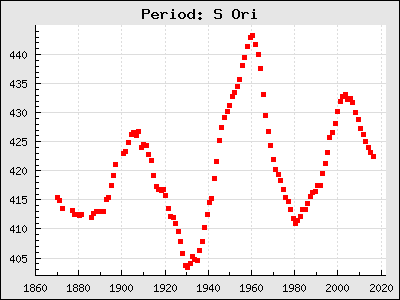
The above graph is a period graph for S Ori from Thomas Karlsson's monumental work of the O/C, Period and Mean Lightcurves of around 490 Mira variable stars. The main webpage of his study can be found at http://var.astronet.se/mirainfooc.php.
It shows that the period for S Ori had a change of around 50 days from about 1930 to 1960. However, the period change seems to be in a repeating pattern that centers itself around a period of 420 days. Although it’s been suggested that this behavior could be related to a “Thermal Pulse” event, this type of period swing is rare and has been described as a “meandering” behavior on the part of S Ori (swinging back and forth). This type of behavior is explored in detail in Templeton and Willson Paper “Secular Evolution in Mira Variable Pulsations” which is very much worth reading.
Maybe 100 years from now this behavior of S Ori might be better understood!
Observing details
S Ori currently has about 17,500+ observations in the AAVSO International Database (AID). Some go back as far as January 5, 1871 so it’s been well observed over the years and has had a number of papers written about it.

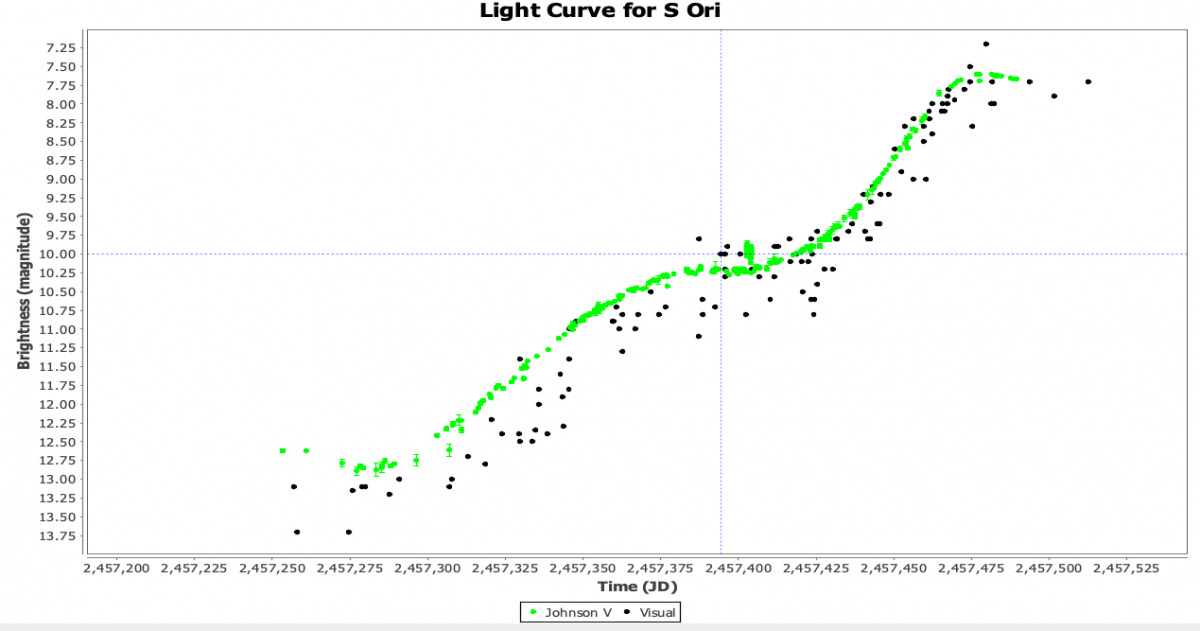
LC in V and Visual for S Ori for the last 5,000 days
I became interested in observing S Ori because it was the first LPV I noticed with a “Hump” or “standstill” on the ascending part of it’s light curve. Since then myself and others have found more then 70 Miras that has shown this type of behavior. In fact maybe 30% of the Miras Light Curves (LC) I looked at showed this behavior at least once in the last 20 years. Please see my “humps” webpage at https://www.aavso.org/lpv-humps for further information.
On the above LC graph, the “hump” events shows up as a thickening in the observations in the raising LC on some cycles. They are show up better when the LC for a particular cycle is expanded. The are somewhat more difficult to see in older, Visual only LCs.
The slowdown and then standstill of the magnitude for S Ori and then the stand still stopping and the brightness of the star continuing getting brighter is easy to see in this example.
The above LC of S Ori is the result of a high cadence study (the goal was at least one image a day) of the raising or ascending part of the LC for S Ori during a “hump” event. The study went from August 18, 2015 to April 11, 2016. The study did continue on the next period/cycle for S Ori (not shown here). I used images from my own observatory, images from AAVSONet Bright Star Monitor (BSM) and from other astronomers who either helped or were also following the star. There was clear weather somewhere around the world most days.
I was trying to find points on the light curve where the brightness started slowing down and later speed up. I did high cadence at those times with my own telescope (3 minute cadence with 4 filters for 5 hours). I was looking for flickers and other evidence of types of chaos at those points to perhaps help discover more about this type of event.
Please keep in mind of what is occurring on the star during this light curve. When the star expands the outer photosphere of the star is pushed out from the star and that outer edge cools off allowing molecules to condense that have the effect of reducing the amount of visible light able to get through this atmosphere. This causes the light we see to drop off but the “dust” formed doesn’t effect the Ic light as much. This goes on until around the time that the Minima of the star is seen. This would be the best time to look for a close “blue” companion if it exists.
Then the gravity of the star starts pulling this material back toward the star. This causes the material in this outer edge of the photosphere to heat up which causes the molecules to dissipate, allowing more light through the other photosphere of the star to be seen causing an increase in the LC seen in optical light. This continues until the star reaches it’s minimum size. This corresponds to the Maxima of the LC seen. Then the cycle starts again.
Something occurs in the atmosphere/ photosphere of the star which causes this heating up and dissipation of the heavy molecules to slow down and stop for a period of time. I don’t believe there is a consensus of opinion of what causes this behavior in some Mira stars but it might be related to a secondary wave in the star. I was amazed that something on this scale could happen to a giant Mira!
Just as the “humps” don’t show on each period for S Ori, the length and shape of the “standstill” seems different for each time it shows up. This could be expected since the LC for a Mira varies from cycle to cycle for unknown reasons.
This LC is for the same time period but shows B, V, R and Ic color bands along with visual observations. The same “hump/standstill” is seen in all 4 bands. However, as is typical with a Mira, the event has a larger effect in B and V bands then it does in R and Ic bands. I feel that this event showing up in Ic gives the most important information as this band is least affected by the molecular material (dust) that forms. Just my opinion!
Spectrum at each major point would be ideal but it’s difficult to find somebody willing to take spectral observation. However, basically Photometry is low resolution spectroscopy so the photometric measurements can be of use in this area.
The important relationships for Miras (particularly one with humps and dual-maximas) is the B-V index and the V-Ic relationship. More importantly, the data used to calculate these indexes should be on the same standard, particularly if the images are taken by multiple people. In other words, the images need to be transformed to the same standard.
In the above study only a small percentage of the data was transformed which made the data less useful when looking for photometric differences (spectrum differences) between the Minima part of the LC, at the start, during and at the end of the “standstill”, and at Maxima to get an an idea of the makeup of the outer photosphere of the star at each of these points. I’d particularly would look at any changes during the “standstill” itself.
If I ever do a study like this in the future I would stress the importance of “transforming” B, V and Ic band images and only use images that were transformed, throwing out ones that were not transformed.
This is not only true for looking at Miras with “humps” but at any Miras, particularly one’s that Andrew and I have written about in the “LPV of the Month” articles the last few years.
Final Points
It’s not just the Maximas and Minimas on LPVs that can be of interest to the observer but sometimes events that occur on the actual LC itself like the “humps/standstills”. Sometimes they can be interesting!
Some professionals have reported flare-like activity during the Minima of some Miras, some lasting for days. If very careful, it might also be possible to catch a close companion that a LPV might have during the Minima.
In Miras that have Dual-Maximas, sometimes there could be a difference in the makeup of the star light in two Maximas which might give a clue how the two Maximas form or their relationship to each other.
Some Miras that are Carbon stars seems to show possibility of dust rings that may surround the star that seems to give some difference in photometric longterm values.
But as always observe Variable Stars that interests you and have fun!
References
Melikian, N. D., “Classification of the Light Curves of Mira Variables”, 1999, Astrophysics, Vol. 42, No. 4
Reid, M. J., Goldston, J. E., “How Mira Variables Change Visual Light by a Thousandfold” , 2001, The Astropysical Journal, 572, 694
Templeton, M., Mattei, J.A., Willson L.A., “Secular Evolution in Mira Variable Pulsations”, 2005, The Astronomical Journal, 130, 776-788
Willson, L. A., Marengo, M., “Miras”, 2012, JAAVSO, Vol. 40
Wittkowski, D. A., et al, “The Mira variable S ORI: Relationship between the photosphere, molecular layer, dust shell, and SiO maser shell at 4 epochs”, 2007, Astronomy and Astrophysics, https://arxiv.org/pdf/0705.4614.pdf
Further reading
https://www.universeguide.com/star/sorionis
https://en.wikipedia.org/wiki/S_Orionis
https://www.sciencedaily.com/releases/2007/05/070531120826.htm
https://www.eso.org/public/images/eso0725a/