Fri, 08/03/2018 - 14:13
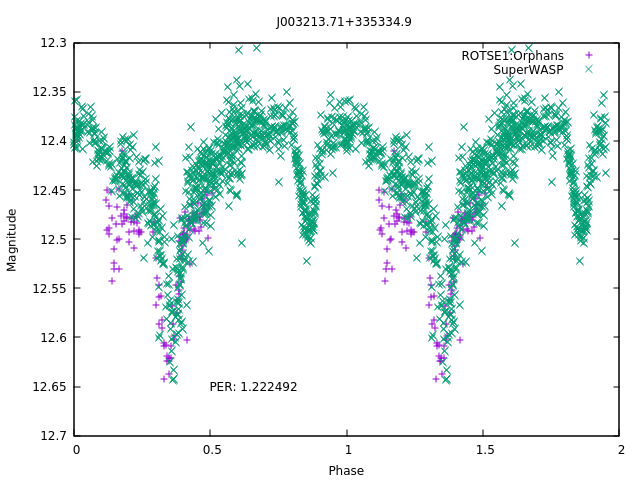
I am attempting to phase an object that I believe is an eclipsing system. While I can successfully phase the ROTSE1 and SuperWasp data to align the primary minima, none of the surveys I have used thus far (CRTS, APASS, ASAS-SN, NSVS) have data points that corroborate the second minima. I am fairly confident that the period is 1.222492 days. Are there any additional surveys that would be sensitive enough to substantiate my plot? Alternatively, is there a method of calibration that would determine if points corresponded to the second minima?


Excuse me if I am not helpful with my response. As you did not indicate how you measured the period, I have no way of determining whether you have already done what I am about to suggest.
The tool I would use in your place is the Lomb-Scargle periodogram. In Python it is scipy.signal.lombscargle, but my own familiarity with it comes from Press, et al, Numerical Recipes, 3rd edition, pp 685-687. What I like most about it, aside from its ability to operate with unevenly spaced data, is that one can easily compute the significance level associated with any frequency peak. That would enable you to make a quantitative statement about the second period. If you use the Scipy routine you will have to write an additional script to calculate the significance, but that is not hard to do; see Press, et al.
CS,
Stephen
Hi Ian,
Are you asking about how to confirm that what appears to be a nice secondary eclipse, really is an eclipse and not a data "artifact" ? So, you are asking for either some algorithmic method of confirming this data corresponds to an eclipse, or an additional data source that would have data points in the secondary?
Algorithmically, it would probably be easy to make a lightcurve model that would fit, especially since you have single colour data and probably no radial velocity information (i.e. the modelling is fairly unconstrained). That's the only route I can think of, but it would only show the secondary is plausible, not be absolute proof.
But perhaps the easiest and most convincing way would be to gather some more data... I could observe it for you (I'm assuming you're not an observer, or you'd already be doing that?), but given the ROTSE data is from a short time period about 19 yrs ago +/-, and the SuperWASP from a short time span about 10 years ago, there will be enough uncertainty in the ephemeris that it may take a couple of runs to hit it (especially with the short nights right now -- I am at 51 N ). Also, to my eye, on your phased LC the SuperWASP data primary eclipse seems just slightly offset from the ROTSE eclipse. So perhaps needing a slight tweak to the period to fit both.
If you send me epoch, in addtion to the period you have, I will try to observe it.
FWIW, I think most people would be comfortable with declaring this an EB without a second data source. E.g. the many papers by Otero and colleagues that mined NSVS data. Many other workers too, but I happen to use the Otero+ list a lot, so that is what first come to mind.
I hope this helps.
Gary Billings
Hi Ian,
Your target of investigations is 1SWASP J003213.70+335335.2. The SWASP data have huge scatter in magnitude and in HJD. The folded LC with period =1.218779 days (most probable acc ANOVA search) and epoch of 2453236.644306 HJD do show almost equal in depth primary and secondary minima. (see the attachments)
As Gary offer to you it is necessery to obtain new observational data with good S/N ratio and reasonable scatter in data.
Regards,
Velimir