Leadership team: David Whelan
Contributions from Ryan Maderak, Ulisse Munari and Stella Kafka
Interested in joining this section? Click here for instructions.
Watch the Spectroscopy Observing Section webinar (recorded August 22, 2020).
Introduction
Spectroscopic monitoring of variable stars is a relatively unexplored domain within astronomy, with the potential to produce a wealth of new information. While individual objects, such as some cataclysmic variables (CVs), have been studied with high time resolution spectroscopic observations spanning days or weeks, long-term spectroscopic monitoring data for variables does not yet exist. Many interesting variable phenomena occur on time scales of months or years, meaning we lack the information that could prove critical in advancing our understanding, and in solving long-standing problems (such as the perplexing behavior of Semi-Regular variables or the still-not-fully-understood RV Tauri variables). Even for shorter period variables, there is surely much to be learned from high time resolution spectroscopic observation. There are many bright variables with little spectroscopic data available, meaning observers with spectroscopes on smaller telescopes have an opportunity to make an impact!
We provide here brief overviews of: the information that we can derive from a star’s spectrum; how to work with spectroscopic data; what to consider when selecting equipment for spectroscopy; the specific types of variables we recommend for spectroscopic observation; and, how to submit your spectra to the AAVSO. Much more detail is provided in the accompanying manuals and guides.
Introduction to Stellar Spectra
A basic stellar spectrum consists of the star’s thermal (aka blackbody) spectrum, which forms the continuum, with dark absorption lines resulting from atomic energy level transitions; some types of stars can also have bright emission lines (also corresponding to atomic energy level transitions). The strength of these atomic lines depend on the abundance of each element within the star, as well as the temperature and density of the star’s outer layers. Absorption and emission lines in a star’s spectrum can therefore be used to determine the physical properties of the star, as well as its chemical abundances/composition.
The surface temperature of a star can be represented by its spectral type, using the letter sequence: O B A F G K M, from hottest to coolest. This sequence is based on the strength of the absorption lines in the star’s spectrum, primarily hydrogen lines, which strengthen from O to A, then weaken from A onward; the H & K lines of calcium strengthen from A onward, aiding the classification of cooler stars. For each letter, numbers from 0 to 9 are used for finer classification; for example, the Sun is G2. Roman numerals are added to denote the luminosity class, from I for supergiants to V for main sequence stars (those in the same evolutionary stage as the Sun). Luminosity class is assigned based on how broad the spectral lines are: class V (main sequence) stars have the broadest absorption lines because their atmospheres are higher density, and collisions between atoms cause the energy level transitions to become less well-defined (this is called collisional broadening); class I stars have the narrowest lines.
The Doppler effect applies to light, so the spectrum of a star with relative motion toward or away from Earth will be shifted in wavelength; for motion toward Earth, the wavelengths shift to shorter values (blueshift), and for motion away from Earth, the wavelengths shift to longer values (redshift). Therefore, by comparing the wavelength of a line in a stellar spectrum to its known value, we can determine its radial velocity relative to us. If an object is rotating, then light from one side is red shifted and light from the other is blue shifted. This causes spectral lines to be rotationally broadened. Outflows of material from stars (like those that occur in CVs) in are also revealed through Doppler shifts, specifically of emission lines from the outflows.
Summarizing the science that can be done with spectra (given the background provided above): Absorption lines can provide abundances of stars, which may shed light on the mechanisms of stellar pulsation (which is driven in part by atomic absorption, aka opacity); Emission lines can be used to investigate the conditions in extended stellar atmospheres and outflows (of interest in CVs and Novae); Radial velocities can be used to study the dynamics of pulsating variables, stars with outflows, and also eclipsing binaries.
Spectroscopic Data
The details of processing and reducing spectroscopic data are described in the AAVSO Spectroscopy Manual. Spectroscopy requires the same basic calibration data and corrections as for imaging and photometry, including darks and flats; but, note that flat-fielding is applied differently because it is used to normalize the spectrograph response as well as the CCD response. The major difference with spectroscopy is the need for wavelength calibration spectra. These can be taken using a calibration lamp (typically neon and/or argon), or an object with known lines, such as the Sun (via the solar sky spectrum). A single spectrum usually spans multiple rows/columns in the direction perpendicular to the dispersion, so these must be co-added (this may happen before or after the wavelength calibration, depending on the spectrograph configuration). The spectrum will usually be normalized to the continuum level before being used for science.
Instrumentation and Observing
A basic spectrograph consists of a slit or fiber that provides the initial dispersion (through diffraction), the light from which then passes through a prism and/or diffraction grating to provide the full spectral dispersion (but note that some gratings are reflection gratings; also, objective prism spectrographs also exist, where a prism is used as the objective element of the telescope). One of the principle challenges of taking spectroscopic data is keeping the star aligned with the slit or fiber, which typically requires a guide star.
Because the light is dispersed, you will usually be observing much brighter stars than could easily be observed for imaging or photometry, for a given telescope aperture. Therefore, while low to mid-resolution spectra can feasibly be taken with smaller aperture telescopes (8 inch or less), apertures of at least 10 – 12 inch are recommended for high resolution spectra, even for bright stars. Exposures of at least several minutes will often be necessary to achieve a signal-to-noise ratio that is suitable for doing science. Note that spectrographs that use grating often have modular gratings, allowing different resolutions. The resolution needed depends on the science being done: radial velocities and strong lines can be measured at low resolution, but for more precise objectives such as examining the line profiles (i.e., the shapes of the lines, which can reveal small motions, or other detailed effects), higher resolution will be necessary. Detailed guidelines for selecting equipment and conducting observations are discussed in the AAVSO Spectroscopy Instrumentation and Observation Guide.
Quick tips:
How to calculate your dispersion scale: If your CCD has 2000 pixels and your recorded spectrum covers 500 Angstrom, the dispersion scale is 0.25 Angstrom/pix.
How to calculate the resolving power: If an intrinsically narrow line (like an isolated one in the comparison spectrum) has a FWHM of 3 pixels than, in the example above, its FWHM in Angstrom is calculated as: (3 x 0.25) = 0.75 Angstrom. The resolving power is expressed as lambda/dalta lambda, so observing the H-delta line (at 4101 Angstrom), a FWHM=0.75 Angstrom corresponds to a resolving power 5500. Equivalently, a FWHM=0.75 Angstrom for the H-alpha line (at 6563 Angstrom) corresponds to a resolving power of 8750
Program Priorities - recommended targets and projects
 Chromospherically Active Stars
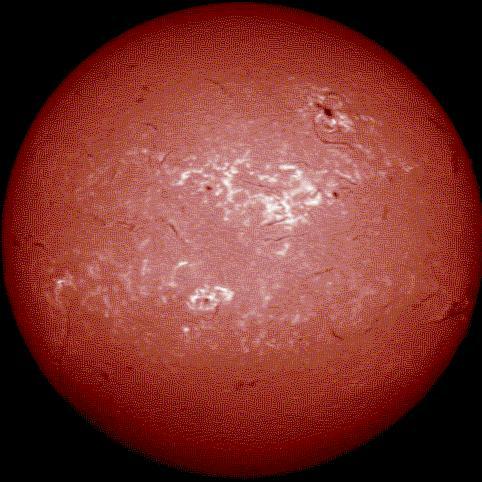
Emission regions: Hydrogen and CaII H&K (chromospheric emission); Absorption features: CaII H&K. Looking for EW changes. Resolution at least 1000. Observe once/week. Selected targets:
| Star | Average mag. |
| chi Dra | 3.5 |
| UV Cet | 6.8-13.0 |
| eps Eri | 3.73 |
| Barnard's star (V2500 Oph) | 9.55 |
| RS CVn | 8-9 |
| BF Lyn | 7.7 |
Spectroscopic binaries
| Star | P (days) | Out-of-eclipse brightness | Notes |
| b Persei | 1.53 | 4.6 | hierarchical tripple |
| Beta Per (Algol) | 2.87 | 2.1 | |
| zeta Cen | 2.29 | 2.5 | |
| bet Lyr | 12.94 | 3.3 | |
| AP Psc | 96.44 | 6.04 | |
| TV Cas | 1.81 | 7.22 |
Observations of pulsating stars, allow researchers to note trends between spectroscopic and photometric observations which reveal processes in various layers of stellar atmospheres. These trends then lead to a physical understanding of the star, and formation of relevant models of atmospheric dynamics.
- RV Tauri variables (by Ryan Maderak)
Spectra will enable studying radial velocity curves and line profiles in order to examine the complex motions within the atmosphere
At maximum light, high resolution (R > 10,000) is required, and high SNR of 80 – 100 per pixel. At minimum light: SNR could be as low as 50. This will require total integration times of 30 - 60 minutes on small scopes.
Wavelength coverage: H-alpha +/– 100 angstroms, erring on the red ward side if spectral range is limited.
Targets of interest (desired cadence: as frequently as possible, at least one spectrum per night):
| Star | P (days) | Bright mag. | Faint mag. |
| R Sct | 140 | 4.9 | 6.9 |
| U Mon | 92 | 5.1 | 7.1 |
| AC Her | 75 | 6.4 | 8.7 |
- Mira variables (by Ulisse Munari)
Medium-to-low resolution spectrographs (dispersion higher than 2 AA/pixel):
-There are no special requirements to be able to measure the depth of molecular bands (e.g. TiO). A dispersion between 2 and 6 °A/pix will do fine.
- Are there shocks in the pulsating atmosphere (derived from the relative strength of Balmer lines – strength of H-alpha, vs strength of H-beta vs strength of H-gamma)?
High resolution spectrographs (need dispersion 0.2 °A/pix or better):
- Radial velocities (RVs) of Balmer lines, covering the pulsation cycle - Are there long-term variations in the light curves of such objects with time?
- Is there a variation of the shape of the RV curve with the pulsation period?
- Compare RV changes of various types of Mira variables - similarities and differences
- How does the RV curve obtained from measurements at the center of strong molecular bands compare with RV measurements of lines away from molecular bands ? Do we see different amplitudes? Different phases perhaps ?
For both high and low resolution spectra:
- How does the profile of an emission line change in shape (multiple peaks, asymmetric shapes, super-imposed sharp absorption components, etc.) along the pulsating cycle? (focus on H-alpha line)
Stars of interest (desired cadence: 1 spectrum per star per week):
| Star | P (days) | Bright mag. | Faint mag. | spectrum/type |
| R And | 409.2 | 5.8 | 15.2 | S3,5e-S8,8e(M7e) |
| omi Cet | 331.96 | 2.0 | 10.1 | M5e-M9e |
| Y Per | 248.60 | 8.1 | 11.3 | C4,3e(R4e) |
| R Lep | 427.07 | 5.5 | 11.7 | C7,6e(N6e) |
| S Cam | 329.9 | 7.7 | 11.6 | C7,3e(R8e) |
| R Gem | 369.91 | 6.0 | 14.0 | S2,9e-S8,9e(Tc) |
| V Cnc | 269.7 | 7.6 | 13.3 | S0e-S7,9e |
| R Leo | 309.95 | 4.4 | 11.3 | M6e-M8IIIe-M9.5e |
| S UMa | 225.87 | 7.1 | 12.7 | S0,9e-S5,9e |
| R Hya | 388.87 | 3.5 | 10.9 | M6e-M9eS(Tc) |
| V CrB | 357.63 | 6.9 | 12.6 | C6,2e(N2e) |
| V Oph | 297.21 | 7.3 | 11.6 | C5,2-C7,4e(N3e) |
| X Oph | 328.85 | 5.9 | 9.2 | M5e-M9e |
| R Aql | 269.84 | 5.3 | 11.9 | M5e-M9IIIe |
| khi Cyg | 408.05 | 3.3 | 14.2 | S6,2e-S10,4e(MSe) |
| U Cyg | 463.24 | 5.9 | 12.1 | C7,2e-C9,2(Npe) |
| T Cep | 388.14 | 5.2 | 11.3 | M5.5e-M8.8e |
| X Aqr | 311.4 | 7.2 | 15.0 | S6,3e:(M4e-M6.5e) |
- Cepheids and RR Lyrae Variables (by Róbert Szabó and the TESS RR Lyrae and Cepheid survey team)
For Cepheids and RRLs, spectroscopy is particularly useful to determine radial velocity curves of the star, and explore changes of the line profiles along the pulsation cycle. Radial velocity studies are based on as many metallic lines as possible, so echelle spectra (R~10,000) with a broad wavelength range are the best. Also, line profile variations (variations in the shape of the spectral line) can give more detailed information about motions in line-forming regions (and about the geometry of the pulsations, as for those stars the main pulsation is radial). Lower resolution spectra covering the optical range around 4500 - 6500 AA are needed to detect line profile changes during a pulsation cycle.
In particular:
For Cepheids: Either a broad coverage in the optical 4500-6500\AA for precision RVs, or individual lines (such as Halpha, Ca II triplet) that could be expected to show some interesting variability or shock phenomena.
| Star | Bright mag. | Faint mag. | Notes |
| XZ Cet | 9.24 | 9.71 | prototype of Anomalous Cepheids |
| BL Her | 9.70 | 10.62 | |
| V533 Cen | 8.21 | 8.74 | C-rich Cepheid |
| RT TrA | 9.43 | 10.18 |
For RR Lyr: a broad coverage in the blue/optical 4000-6500\AA, Balmer lines and the D3 Helium line at 5872 AA are of interest. Slightly bluer wavelengths might be better for RR Lyraes, because there are pulsation phases when their spectrum becomes rather featureless.
| Star | Bright mag. | Faint mag. | Notes |
| RR Lyr | 7.17 | 8.14 | prototype; canging Blazhko; additional pulsation modes |
| MT Tel | 8.70 | 9.25 | |
| RZ Cep | 9.15 | 9.72 | |
| SV Hya | 9.78 | 11.0 | |
| SU Dra | 9.18 | 10.27 | |
| X Ari | 9.04 | 9.97 |
Integration times should be adjusted based on the pulsation period of the star. A spectrum per 0.05 phase units (or better) is a good coverage for all pulsation periods, especially if the pulsation period is less than a day.
Cepheids with X-ray flashes
Requesting any resolution spectra, preferably 1/day or more frequently. Interesting lines: Balmer (absorption) at different phases of the pulsation period.
| Star | Min period | fMax period | Notes |
| Polaris | 1.97 | 2.00 | period is increasing |
| Delta Cep | 3.49 | 4.36 | |
| V473 Lyr | 5.99 | 6.35 | |
| V1334 Cyg | 5.77 | 5.96 | |
| VY Pyx | 7.13 | 7.40 |
Wolf-Rayet (WR) outflows (Noel Douglas Richardson)
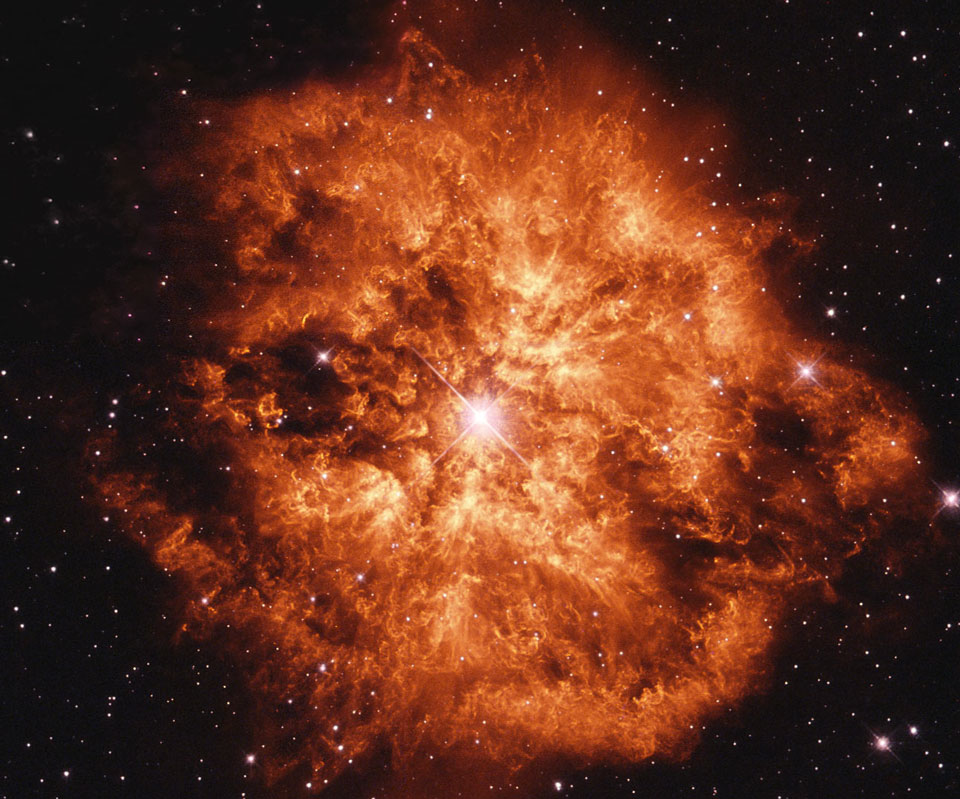
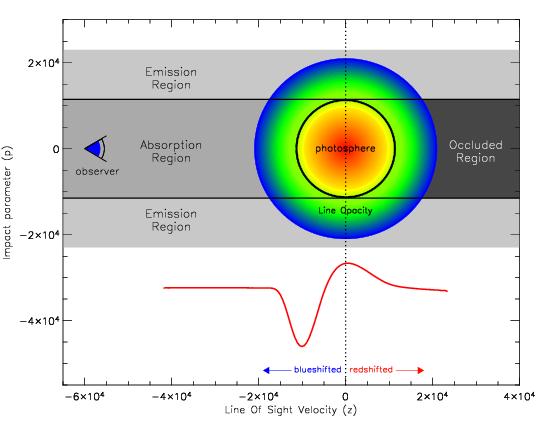
Emission: highly ionized He, Si, O, N or C; strong stellar winds with P Cygni absorption profiles; enhanced heavy elements. Lines change with time, as winds evolve and expand. Study long-term evolution of line profiles, and evolution of P-Cygni. Great targets for star analyzers!
Stars of interest (desired cadence: 1 spectrum per night or continuous monitoring):
| Star | Bright mag (V) | Faint mag (V) | Spectral type |
| Eta Car | -1.0 | 6 | pec(e) |
| tet Mus | 5.5 | 5.52 | E/WR (WC6+O9.5I) |
| DO Eri | 5.97 | 6 | A5p(Sr-Cr-Eu) |
| V1770 Cyg | 7.36 | 7.52 | WR |
| V1687 Cyg | ~4 | WR | |
| V1679 Cyg | 7.86 | 7.93 | WR |
 Semi-detached systems (Christian Knigge and Stella Kafka)
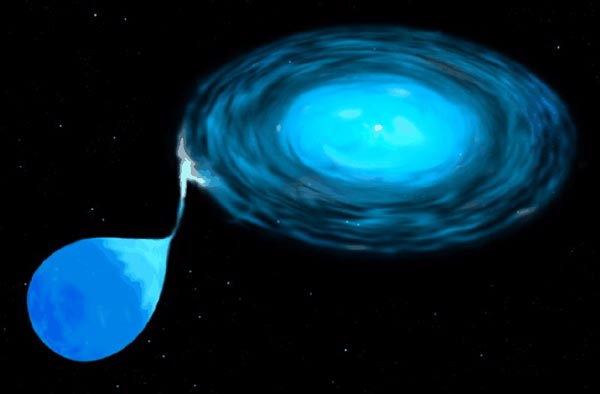
Semi-detached binaries consist of a white dwarf accreting material from a low-mass main sequence or giant donor star. Most of the light observed in those systems is accretion generated (accretion disk, hotspot on the disk, accretion column), and is quite variable in all wavelengths. Depending on the optical state, the spectrum can change from broad emission to broad absorption; depending on the phase of the orbital cycle and the inclination of the system, the line strength may also change. Therefore, both phase-resolved spectra and long-term monitoring provide valuable information on the accretion process and variability of the system.
Snapshot spectra of CVs are abundant in the literature. However there has not been a systematic monitoring of any one system on timescales of years. The AAVSO observers have been meticulous in acquiring photometry on a number of key targets in the north and southern hemisphere, so their photometric behavior is reasonably well characterized. In parallel with photometry, we request similar long-term monitoring of a selected targets. Desired cadence is one spectrum/day or (in the case of phase-resolved targets) one spectrum/0.1 phase units. All resolutions.
- Dwarf novae in quiescence or outburst (and everything in between). Spectra can track changes as the system gets bright/faint, assess differences between quiescence states, compare the rise to/from outburst etc.
| Star | P (days) | Bright mag. | Faint mag. | Notes |
| SS Cyg | 0.275 | 7.7 | 12.4 | |
| U Gem | 0.176 | 8.2 | 14.9 | |
| VW Hyi | 0.074 | 8.4 | 14.4 | |
| GK Per | 1.997 | 9.5 | 14.0 | Nova Per 1901 |
- Nova-like CVs: high mass transfer rate objects, sometimes exhibiting optical winds (P Cygni profiles) in their HeI lines. Some of them also show high and low optical states, presumably due to cessation of accretion. They are dominated by their bright accretion disk.
| Star | P (days) | Bright mag. | Faint mag. | Notes |
| IX Vel | 0.194 | 9.1 | 10 | |
| RW Sex | 0.245 | 10.39 | 10.84 | |
| V3885 Sgr | 0.207 | 10.27 | 10.51 | |
| TT Ari | 0.137 | 10.2 | 16.5 | High/low states |
| V603 Aql | 0.138 | 11 | 12.4 | High/low states |
| MV Lyr | 0.133 | 12.2 | 18 | Deep low states |
- Miscellaneous Peculiar CVs
| Star | P (days) | Bright mag. | Faint mag. | Notes |
| BT Mon | 0.334 | 14.5 | 16.4 | deep eclipses |
| QU Car | 0.454 | 10.9 | 11.7 | outflows? |
| V Sge | 0.514 | 8.6 | 13.9 | prototype - bright/faint states |
| AE Aqr | 0.412 | 10.18 | 12.12 | Propeller |
Microquasars are X-ray binaries which exhibit ultra-relativistic bipolar outflows. In these systems, a stellar mass compact object (either a neutron star or black hole) accretes matter from a supergiant companion star through an accretion disk. Emission lines come from the accretion process (disk, disk hotspot or stream) or the mass-donor star. Spectral lines lines such as H-alpha) and He I line at 6678˚A are usually visible and variable depending on the state of the system. Especially the He I 6678˚A line is valuable for the measurement of reliable radial velocities of the primary component to get a constraint on the orbital parameters of the system.
Spectral resolution of ~1000 or higher are required to measure EW, RV and FWHM variations of those lines, and S/N of more than 20. Exposure times need to be adjusted accordingly.
| Star | P (days) | Magnitude range (V) |
| V1357 Cyg (Cyg x-1) | 5.6 | 8.72-8.93 |
| V1313 Aql (SS433) | 13.1 | 12.5 - 15.2 |
| V0615 Cas | 26.5 | 10.4-11.1 |
| V4641 Sgr | 2.8 | 9.0-13.8 |
| V0479 Sct | 3.9 | ~11.3 |
| HD215227 | 60.4 | ~8.7 |
| NSV 16907 | 320 | ~9.1 |
Misc targets of interest
| Target | Var type | Mag range | Notes |
| S5 1803+78 | BLLAC | 13.8-18.1 V | unusual behavior |
| V725 Sgr | LB | 11.9-14.4 V | changing period? |
Individual targets (from alerts and campaigns; desired cadence: as frequently as possible)
Please follow the alert link for more information on spectroscopic requirements of observations
| Target | Var type | Mag range | Alert link | Notes |
| R Aqr | pulsating | 5.2-12.4 V | Alert 696 | spectroscopy needed during eclipse |
| b Persei | eclipsing | 4.55-4.75 | Alert 655 | spectroscopy needed during eclipse |
| N Nor 2018 | nova | 10.5 (at discovery) | Alert 653 | all resolutions, all spectral ranges |
| V1307 Ori | HerbigAeBe | 9.48-9.83 V | Alert 657 | H-alpha spectroscopy, all resolutions |
| R Mon | HerbigAeBe | 11-13.8 B | Alert 657 | H-alpha spectroscopy, all resolutions |
| V1410 Ori | HerbigAeBe | 9.39-9.73 V | Alert 657 | H-alpha spectroscopy, all resolutions |
| V346 Ori | HerbigAeBe | 10.1-10.9 V | Alert 657 | H-alpha spectroscopy, all resolutions |
| V1295 Aql | HerbigAeBe | 7.87-7.89 V | Alert 657 | H-alpha spectroscopy, all resolutions |


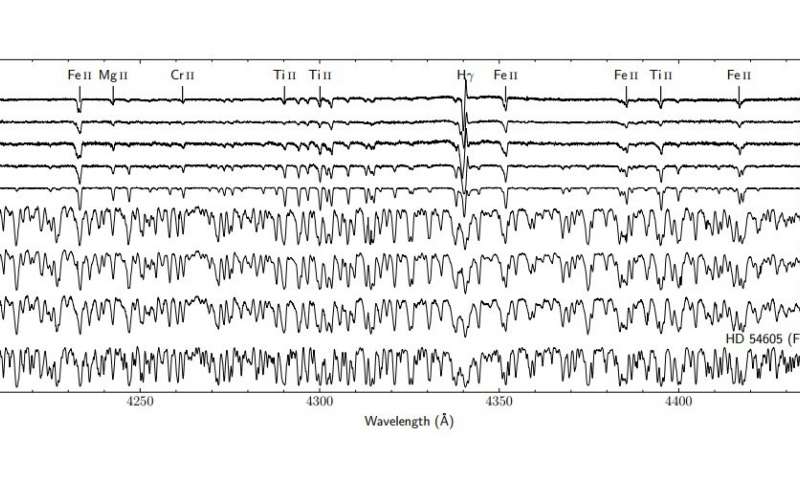
Submitting Data - connect to the spectroscopy database
Before you may submit spectroscopic data regularly, we must first validate your observations of one other spectroscopic standard from the list provided on the HELP page for the AAVSO Spectroscopic Database.


