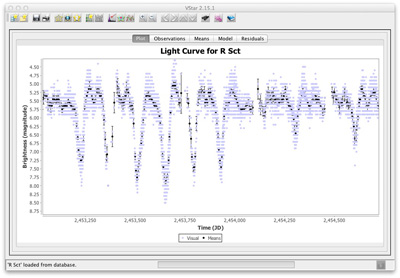
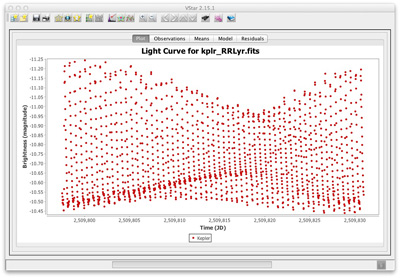
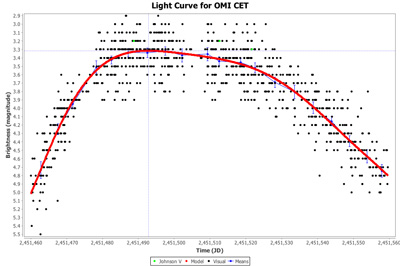
What is VStar?
VStar is a multi-platform, easy-to-use variable star data visualization and analysis tool that was originally developed as part of the AAVSO's Citizen Sky project. Data for a star can be read from the AAVSO database or from a text file of your own creation. It will plot the data on a light curve and then it's up to you what happens next!
Launching VStar
There are two ways to launch VStar - using Java Web Start in which case the code stays on our server and only a small file is downloaded to your computer or by installing the code and running it offline on your own computer.
Please note that in order to run VStar, you need to have the Java Runtime Environment 1.8 or higher installed. VStar should run on any operating system that supports Java.
With Java Web Start ™ technology, you will always get the latest version whether you save the start-up icon to your desktop or launch the program directly. You will see a warning dialog box, similar to those presented by other Web-downloaded applications. Click the "Trust" button, in order to launch VStar.
If you have a firewall which blocks connection to the AAVSO server or your system will not allow the use of Java Web Start applications, you should use one of the installers.
VStar Packages for Download:
You can also download the latest version of VStar directly from its GitHub site: https://github.com/AAVSO/VStar/releases/tag/2.21.2
VStar User Manual
Change Log
If you have any trouble downloading or running VStar on your computer, please contact Sara (sara @ aavso.org) for help. It will save time if you can provide as much information as possible on your operating system and version of Java you are using along with details of exactly what you see and any error messages you get.
Using VStar
The easiest way to obtain data to plot is by requesting it directly from the AAVSO International Database. To do this, click the “New Star from AAVSO Database…” button in the upper left corner of the VStar screen, then choose a star from the 10-star drop-down list or type in the name of another star from the AAVSO database. You can change the date range of the plot, use the default range (the last two years worth of data), or select “All data” by clicking the checkbox and hitting “OK”. Other features include the ability to create your own list of favorite stars to view using the "Star Groups" tab under "Preferences" or to filter the data so you can highlight your own observations.
What Next?
If you haven't yet downloaded and read the VStar Users Manual, do so now! This Manual walks you through all of VStar's features and it is recommended that you follow along with VStar itself as you read.
There is also an excellent 5-minute introductory video (95 MB) created by VStar CHOICE course graduate George Sjoberg available for download.
Another interesting exercise is the 5-Star Data Analysis Tutorial (revised in June 2014 by Paul York). This document will introduce you to VStar by walking you through some of the concepts of basic data analysis. We recommend it as the first place to stop for those new to light curves and variable star data analysis. More help links can be found below.
VStar also supports a large number of plug-ins which perform a range of functions from allowing the loading of external data sets to complex filtering to data analysis. All are easily loaded using the "Plug-in Manager". A list of available plug-ins with descriptions and documentation on how to use them is available on the VStar Plug-in Library webpage.
Some of the things you can do with VStar include:
|
Mean Curve
|
 |
|
Phase Plot
|
 |
|
Period Analysis
|
 |
|
Polynomial Fit
|
|
|
Plug-ins
|
 |
Help!
If you still have questions after reading the VStar User Manual, here are some additional resources you might find useful:
- AAVSO VStar forum - Please feel free to post your questions, suggestions, or observations here.
- AAVSO Data Analysis forum - For discussion of data analysis techniques and projects.
- David Benn's VStar blog - Contains good examples of how VStar can be used for data analysis.
- eJAAVSO article: Algorithms + Observations = VStar - Outline of the development, use and future plans.
- VStar Video Tutorial - Video created by George Sjoberg (95 MB .mp4). Click here for (90 MB zipped version).
- Powerpoint Presentation on VStar (English)
- Powerpoint Presentation on VStar (Spanish)
- AAVSO CHOICE courses. There are two courses offered once/year related to VStar:
- How to use VStar (for beginners)
- Analyzing Data with VStar (for advanced users)
Other Information
- VStar is the creation of lead developer David Benn with help from a few volunteers.
- VStar uses the Apache Commons Math library for anova (F-test, p-value) algorithms.
- VStar is made available under the Affero GNU Public License, which requires that the source code be made freely available. Click here to visit its GitHub site.
- When citing the use of VStar in a paper, please use this reference:
Benn, D. 2012, “Algorithms + Observations = VStar”, JAAVSO, v40, n2, pp.852-866.
- Information about libraries used by VStar can be found here:
jcommon-1.0.16.jar (https://sourceforge.net/projects/jfreechart/files/)
jfreechart-1.0.13.jar (https://sourceforge.net/projects/jfreechart/files/)
jmathplot.jar (https://code.google.com/p/jmathplot/)
javacsv.jar (https://sourceforge.net/projects/javacsv/)
antlr-runtime-4.5.3.jar (https://www.antlr.org)
commons-math-2.2.jar (https://mvnrepository.com/artifact/org.apache.commons/commons-math/2.2)
The Citizen Sky Project was sponsored by the AAVSO & NSF award DRL-0840188


